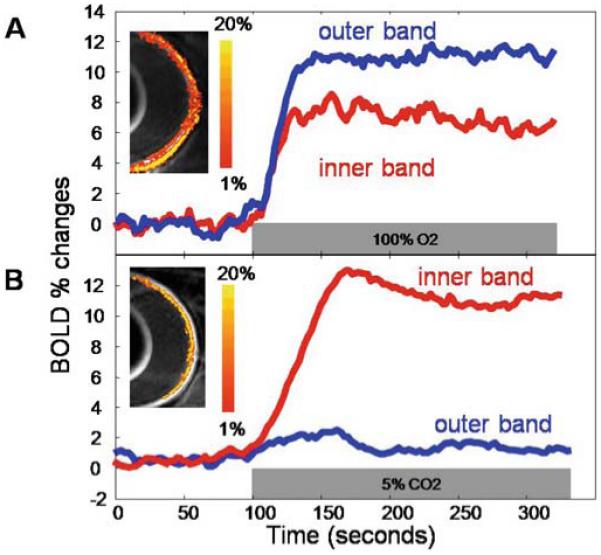
Figure 9.

A, B. Blood oxygenation level-dependent (BOLD) functional MRI (fMRI) response of the retina. Lamina-specific BOLD fMRI responses to (A) hyperoxia (100% O2) and (B) hypercapnia (5% CO2 in air) from a normal rat at 90 × 90 × 1000 μm in-plane resolution. BOLD percent-change maps are overlaid on echo-planar images. The color bar indicates BOLD percent changes. Adapted from Fig. 6 of Cheng et al., Proc Natl Acad Sci U S A.6
