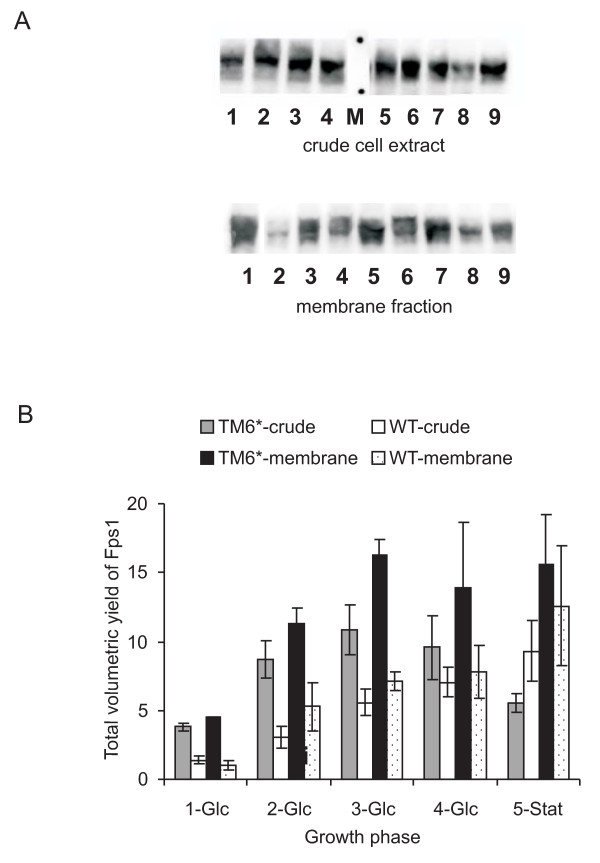
Figure 2.
Fps1 yields produced from KOY.PK2-1C82 and TM6* cells. Samples were harvested at comparable residual glucose concentrations as indicated in Figure 1. (A) Immunoblots of crude cellular extracts (upper panel) of Fps1 produced in wild-type KOY.PK2-1C82 (lanes 1-4) and TM6* cells (lanes 5-8) are shown. Lane 9 is the internal standard. Lanes 1-4 and 5-8 correspond to 1-Glc, 2-Glc, 3-Glc and 4-Glc, in Figure 2B. The marker (M) lane highlights the 98 and 62 kDa standards. The corresponding membrane fraction is shown in the lower panel. Wild-type cells are lanes 2, 4, 6 and 8, and TM6* cells are lanes 3, 5, 7 and 9. Lane 1 is the internal standard. (B) The Fps1 yield per unit of protein was derived from immunoblots such as those shown in Figure 2A and quantified relative to a standard for both the crude cell extract and membrane-bound fractions as described in the Methods section. The total volumetric yield was then derived by multiplying with the corresponding dry weights. Triplicate fermentations were used to calculate the standard error of the mean (SEM).

