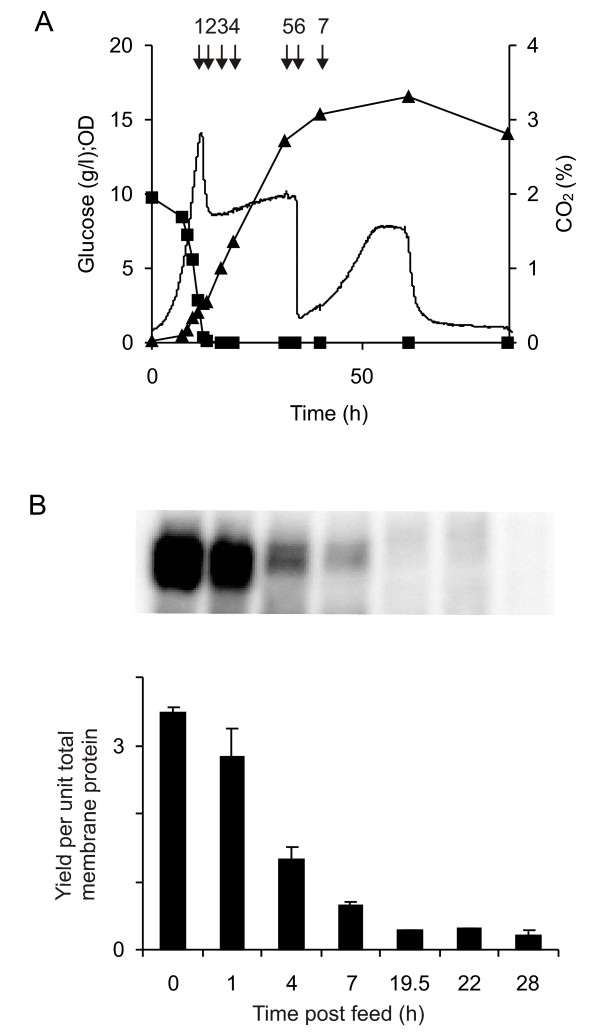
Figure 3.
Analysis of protein yields for a wild-type strain grown under glucose fed-batch conditions in an attempt to mimic TM6*. (A) CO2 production (no symbol), glucose consumption (squares) and OD610 (triangles) show classic profiles for a fed-batch culture. Arrow 1 indicates the onset of the feed (0 h) and arrow 6 the end (22 h). (B) An immunoblot (upper panel) showing the Fps1 production at 0, 1, 4, 7, 19.5, 22 and 28 h after the onset of the feed: its quantitation (lower panel) is related to the internal standard.

