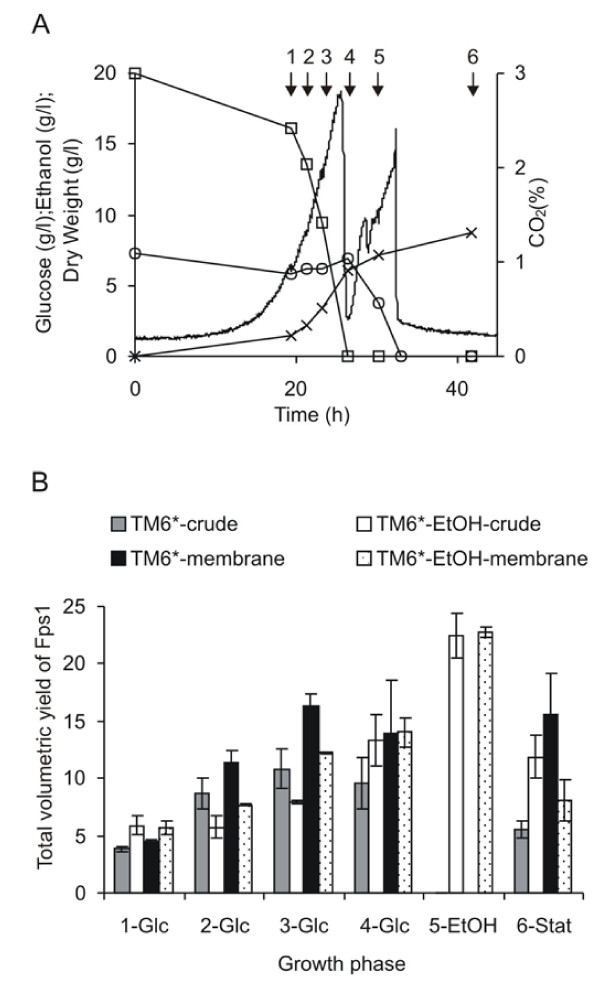
Figure 4.
Analysis of protein yields for TM6* grown on 2 % glucose in the presence and absence of ethanol. (A) CO2 production (no symbol), glucose consumption (squares), ethanol concentration (circles) and dry weights (crosses) were measured. Samples were harvested at the time points indicated with arrows (given numbers for the ease of identification). (B) The yield of Fps1 was related to the appropriate dry weight for the time-point to give the total volumetric yield. At least duplicate fermentations were used to calculate the SEM.

