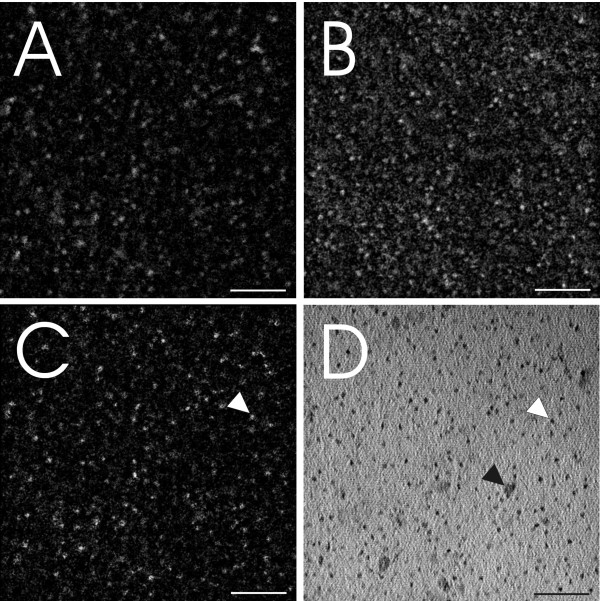
Figure 2.
Electron spectroscopic images of NH2 PEG QDs deposited on a TEM grid. All images are taken at the same area of interest. Images A and B show ESI analysis of S and Cd respectively and figure C represents the signal intersect S/Cd of figure A and B. The bright field image with the QDs is shown in image D. It becomes apparent that not all structures in image D refer to QDs, as there is no corresponding signal in the S/Cd image of figure C (e.g. white arrow = QD, black arrow = non-QD). Scale bars equate to 50 nm.

