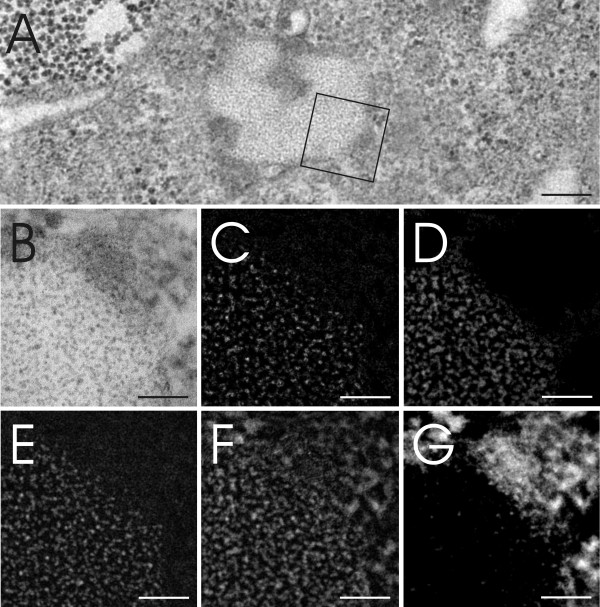
Figure 5.
Elemental analysis of intracellular QDs. Figure A shows an intracellular vesicle containing QDs and the area analyzed by ESI as shown at higher magnification in figure B. Elemental analysis by ESI for S (E), Cd (F) and Os (G) has been performed. Figure C further represents the ESI signal extraction of S and Se. Figure D represents the Se signal without the Os signal. Scale bar A equates to 200 nm and B-G equate to 50 nm.

