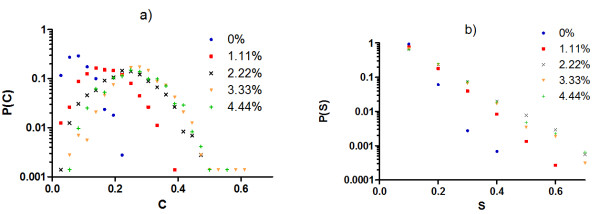
Figure 5.
Probability distributions for a) proportion C of distinct gene products that change state and b) magnitude S of change in gene products. Experiments are shown for degenerate G:P mappings using the same conditions as in Figure 4b, but with the following modifications: 1) perturbations to the system are of single null mutations only and 2) systems are initialized with different amounts of excess resources (% excess indicated by data set label).

