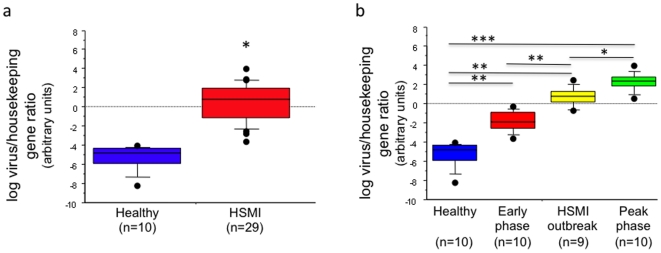
Figure 3. Graphical representation of group differences in the log ratio of virus load normalized to a salmon host gene.
Nonparametric approaches were used to determine statistical significance for comparisons of the relative viral load among healthy and HSMI-affected farmed fish. Log transformations, which did not normalize log ratio distributions, were nonetheless performed for all samples after calculating L1 (virus)/EF1A (housekeeping) ratios to aid in graphical representation. (a) Comparison of adjusted log ratio in mixed heart and kidney samples from healthy farmed fish and farmed fish with HSMI; *, p<0.0001 (Mann-Whitney U); (b) comparison of adjusted log ratios in farmed fish without HSMI (healthy farmed fish), in the early phase of an HSMI outbreak, in the middle of an HSMI outbreak, and during the peak of an HSMI outbreak; **, p<0.0005; *, p<0.01 (individual Mann-Whitney U). Adjusted log ratios also differed significantly across all four farmed fish groups (p<0.0001; Kruskal-Wallis).

