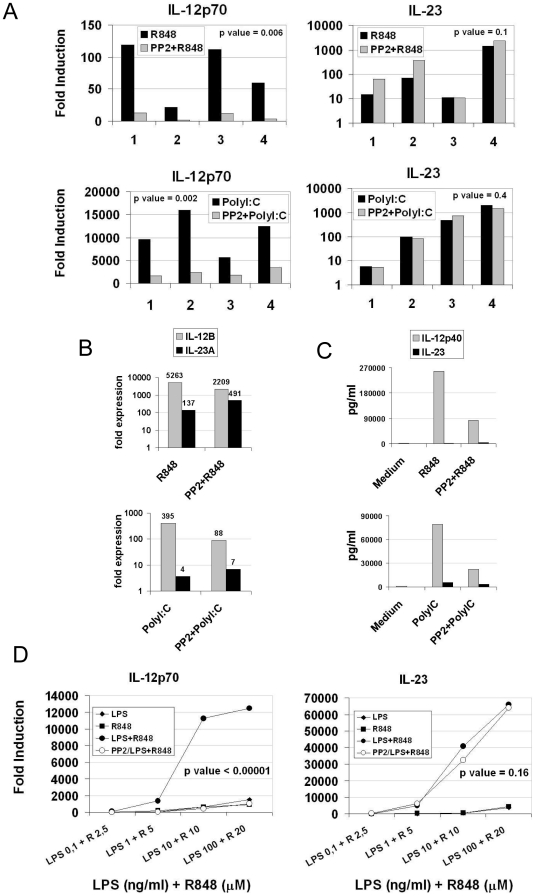
Figure 5. Src kinases inhibition results in imbalanced IL-12/IL-23 production.
(A-C) MoDC were pretreated or not with PP2 (20 µM) and stimulated with PolyI∶C (20 µg/ml) or R848 (10 µM). (A) IL-12p70 and IL-23 release in the supernatant after 24 hours of stimulation was measured by ELISA. Fold induction for the levels of each cytokine compared to unstimulated cells is plotted. Data from four independent experiments and the p values for the differences between the groups are shown (p value <0.05 is significant). (B) qRT-PCR for IL-12B and IL-23A genes was performed after 4 hours of stimulation and expressed as fold increase over basal expression in unstimulated cells. Numbers indicates values of fold induction for each column. (C) IL-12p40 and IL-23 release in the supernatant after 24 hours of stimulation was measured by ELISA. Numbers indicates values of pg/ml for each column. (D) MoDC were pretreated or not with PP2 (20 µM) and stimulated with increasing combined doses of LPS and R848. IL-12p70 and IL-23 release in the supernatant after 24 hours of stimulation was measured by ELISA. Average fold induction of four independent experiments for the levels of each cytokine compared to unstimulated cells is plotted, and the p values for the differences between the groups are shown (p value <0.05 is significant).

