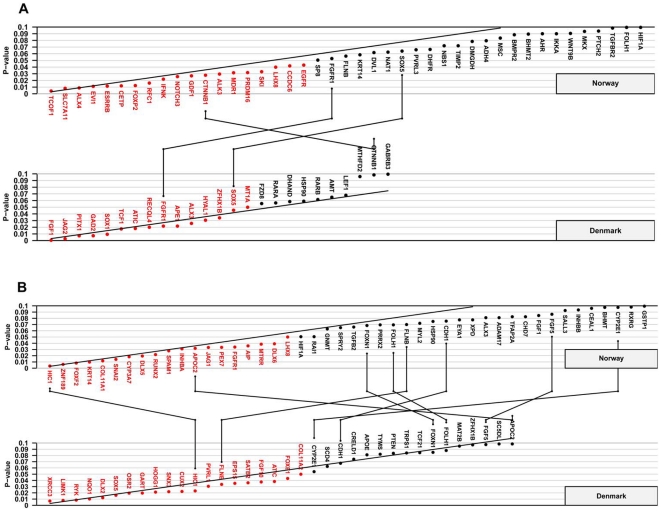
Figure 1. TRIMM analyses of the Norwegian and Danish samples.
Schweder-Spjøtvoll plot of p-values for (A) isolated cleft lip with or without cleft palate (iCL/P) and (B) isolated cleft palate (iCP). All genes with p-values ≤0.1 are shown on the X-axis and ordered according to observed p-values (Y-axis). Genes with p-values ≤0.05 are highlighted in red. The sloping line represents the expected uniform distribution under the null (of no association). Genes with p-values ≤0.1 in both the Norwegian and Danish samples are indicated by lines connecting the upper (Norway) and lower (Denmark) plots.

