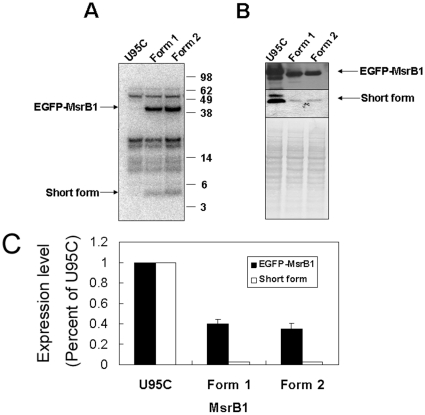
Figure 3. Expression of mouse MsrB1 mRNAs.
HEK 293 cells were transfected with the following constructs: pEGFP-MsrB1 Cys mutant (U95C), pEGFP-MsrB1 with Form 1 3′-UTR (Form 1) and pEGFP-MsrB1 with Form 2 3′-UTR (Form 2). 24 h later, the cells were labeled with 75Se for an additional 24 h. Protein extracts were prepared and resolved on SDS-PAGE gel, and selenoproteins were visualized with a PhosphorImager (A) or by western blot analysis with MsrB1 antibodies (B, top panel). Coomassie Blue staining is shown as a loading control (B, lower panel). (C) Band intensities corresponding to different forms of MsrB1 (B) were quantified with Image J. Protein expression levels were normalized to that of the U95C form. Arrows indicate migration of a full-length EGFP-MsrB1 (42 kDa) and a short form (5 kDa) of MsrB1.

