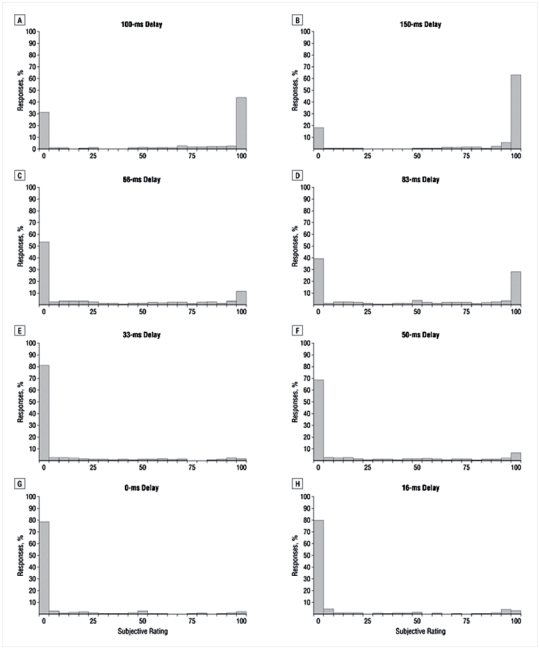
Figure 2. Distribution of subjective visibility ratings.

In both groups, we observed a bimodal repartition of scores, with a first set of responses close to maximal visibility (scale score > 16) and a second set of responses peaking at zero visibility (score < 6). Responses between 6 and 16 were rare (< 10%). More not seen responses were observed in patients than in controls, particularly at short delays.
