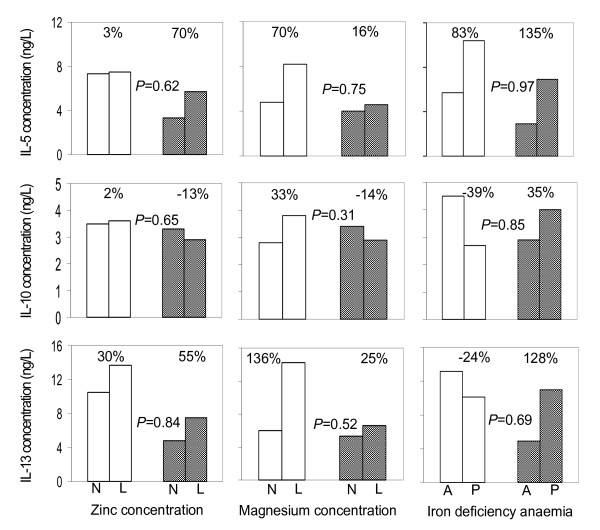
Figure 3.
Associations between micronutrient status and supernatant type II cytokine concentrations following 7 days of PBMCs stimulation with Plasmodium falciparum-infected erythrocytes, by malaria infection status of the child at the time of blood collection. N: Normal concentrations; L: low concentrations; A: absent; P: present. Percentages indicate paired group differences in cytokine concentrations. Data from children without and with malaria infection at the time of blood collection are indicated with open and shaded bars, respectively. P-values indicate the interaction between nutrition status and malaria infection status (nutrient vs. malaria).

