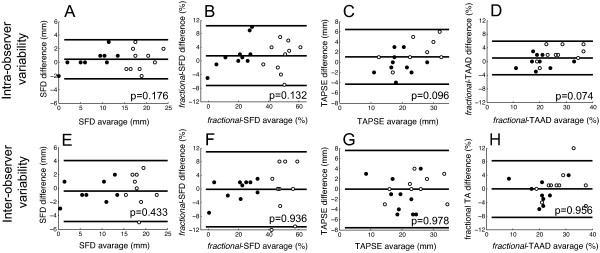
Figure 6.
Analysis of agreement with Bland-Altman plots to illustrate the intra- and inter-observer variability of SF (A and E), fractional SFD (B and F), TAPSE (C and G), and fractional-TAAD (D and H). Mean difference and 95% limits of agreement are shown. Solid dots: PH patients; empty dots: control subjects.

