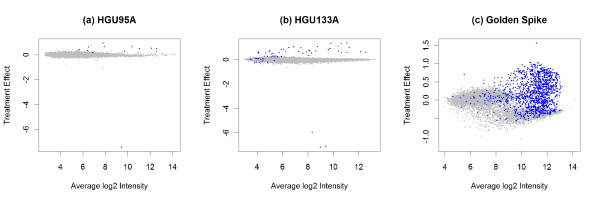
Figure 1.
Gaussian mixture model from PLLM. The plot of average intensity vs. treatment effect as estimated in the PLLM approach is used to identify underlying components in a Gaussian mixture model. The blue points correspond to the known spiked-in genes in each of the three datasets. The Golden Spike dataset has three main components, with one predominantly corresponding to the spiked-in genes. In the other datasets the components are not as clear.

