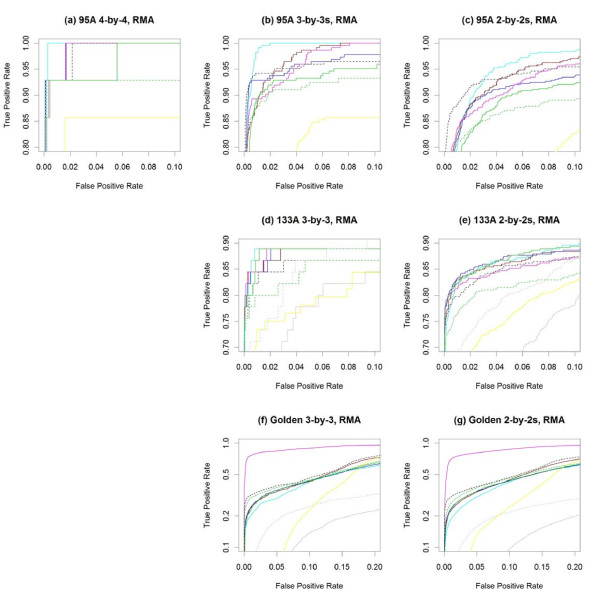
Figure 3.
Partial ROC curves for RMA-preprocessed data. (a-h) Partial ROC curves from Figure 2 to focus on portions of greatest interest - low false positive and high true positive rates. Note that the vertical axes in (f) and (g) are on the log scale to facilitate visualization. The same color legend of Figure 2 applies here.

