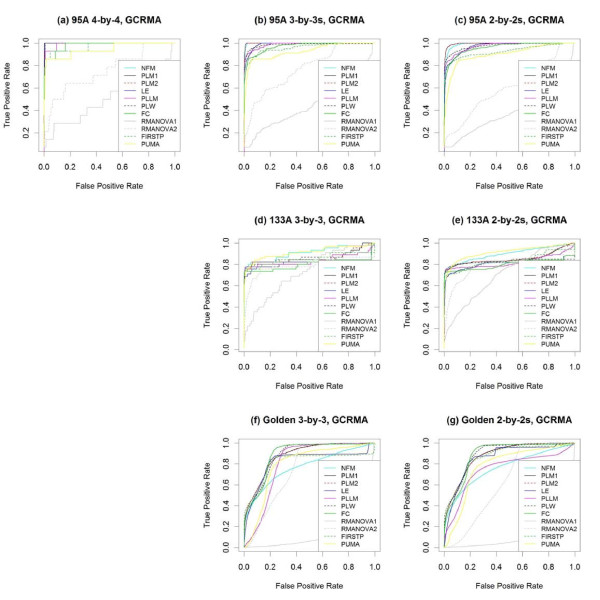
Figure 4.
ROC curves for GCRMA-preprocessed data. With GCRMA preprocessing, the performance of several methods testing for differential expression is compared using (a) the full 4 × 4 comparison of the HGU95A spike-in data, as well as the averages across (b) all 3 × 3 and (c) all 2 × 2 subsets. The methods are also compared using (d) the full 3 × 3 and (e) the average of all 2 × 2 comparisons of the HGU133A spike-in data, as well as using (f) the full 3 × 3 and (g) the average of all 2 × 2 comparisons of the Golden Spike spike-in data.

