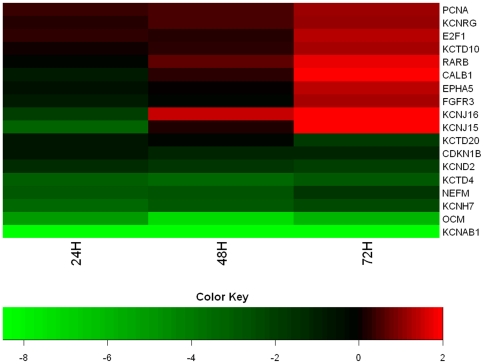
Figure 2. Fold-change differences of selected genes of interest remain stable at 24, 48, and 72 hours.
Shown is a heat map depicting fold-changes between the forskolin and control conditions for a set of genes of interest the three time points indicated. The genes shown were selected because of their known expression in the inner ear (i.e., RARB, CALB1, OCM), ion channel identity (e.g., KCNAB1, KCNJ15), or relevance to the present study (i.e., E2F1). The genes span a range of fold-changes and are both up and downregulated with forskolin treatment. Fold-changes are given as log2(expression in forskolin/expression in control). The directionality of fold-changes was fairly consistent across time points, but there was a slight general trend toward increasing fold-change values from 24 to 72 hours.

