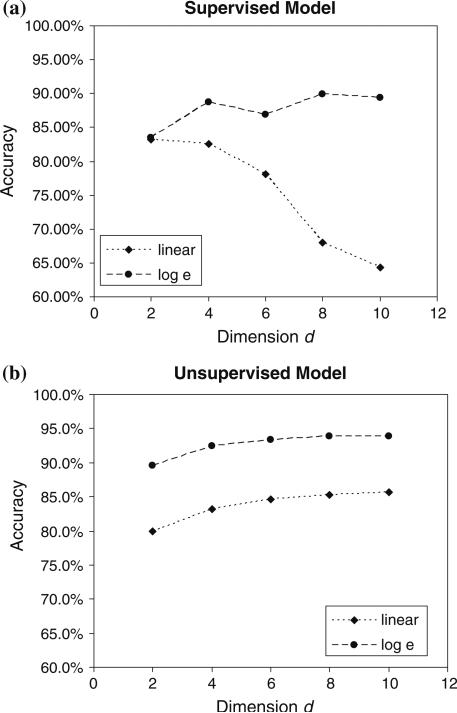
FIGURE 3.
Average overall accuracy across the validation data set when two different time feature vectors scales are used, linear τi and loge(τi), and their dimensionality values are changed as d = {2, 4, ..., 10}. (a) Shows the results obtained from the group model implemented using SVM and (b) shows the results obtained from the individual model implemented using K-means.

