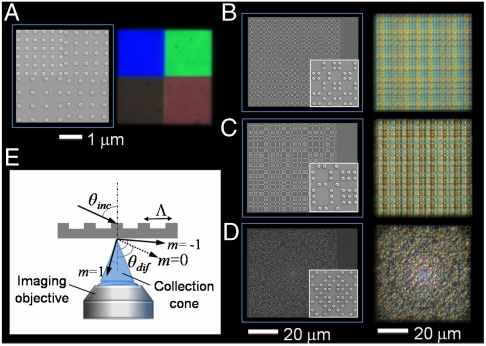
Fig. 1.
Colorimetric fingerprints of periodic and aperiodic gratings. (A–D) SEM images of two-dimensional periodic and aperiodic arrays of 100 nm-radius and 40 nm-high cylindrical Cr nanoparticles on a quartz substrate and the associated dark-field images were illuminated at a grazing incidence with white light. The structural color patterns of the images vary by the N.A. of the imaging objective, in which different diffractive order is included into the collection cone. The periodic arrays in (A) were observed under 10× objective with an 1 mm iris of N.A. reduced to 0.1 and the aperiodic arrays in (B) Thue-Morse lattice (nearest center-to-center separation Λ = 400 nm); (C) Rudin-Shapiro lattice (Λ = 400 nm); (D) Gaussian prime lattice (Λ = 300 nm), were observed under 50× objective with N.A. 0.5. The structural color patterns also vary by increasing the grating period with a progressive red-shift of the scattered wavelengths in (A) (clockwise from top-left) (E) A schematic of the dark-field scattering setup used in the measurements.

