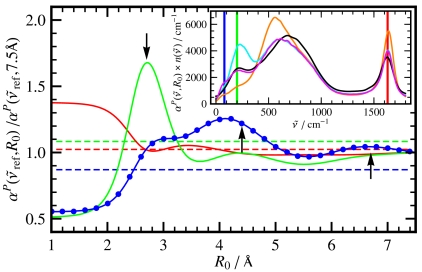
Fig. 3.
Relative intensities from distance-decomposed IR absorption spectra,  of liquid H2O from AIMD obtained from Eq. 7, as a function of R0 at selected reference frequencies
  (blue, dots), 200 (green), and 1,630 cm-1 (red) integrated within a window of
  . The intensities are shown relative to the distance-decomposed absorption intensity at R0 = 7.5 Å, i.e.,
  , where n(80 cm-1)αP(80 cm-1,7.5 Å) = 1,335 cm-1, n(200 cm-1)αP(200 cm-1,7.5 Å) = 2,654 cm-1, n(1,630 cm-1)αP(1,630 cm-1,7.5 Å) = 4,124 cm-1. Vertical arrows mark the successive maxima of the center-of-mass radial distribution function, gcom(r), stemming from contributions due to first, second, and third solvation shell. Horizontal dashed lines mark the usual integrated intensities obtained in the bulk, i.e.,
  obtained from Eq. 1 again relative to
  , corresponding to
  for infinitely large systems. Inset: Overview
  spectra as a function of
  at selected distances R0: R0 → 0 (single molecule limit, orange), R0 = 2.7 Å (cyan), 4.1 Å (magenta), and R0 → ∞ (bulk limit, black). The vertical bars indicate the frequency windows used in the main figure with the same color code.

