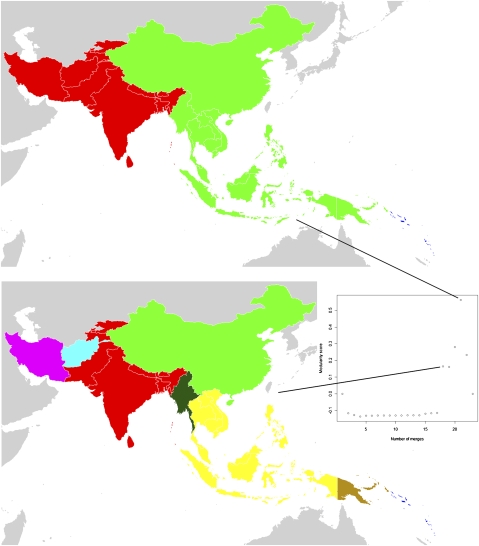
Fig. 3.
P. falciparum migration communities for the Central and Southeast Asia region. Each map represents a different stage of country-merging into communities connected by relatively higher levels of infection movements than to the surrounding regions, with community membership shown by color. For instance, the top map shows that the Solomon Islands and Vanuatu form a community (colored dark blue). The plot in the center-right shows the overall strength (measured by modularity score) of clustering at different stages of merging countries together into communities. The stage that each map shown represents is identified by the connecting lines.

