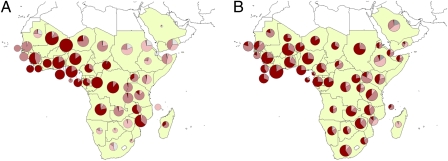
Fig. 4.
Africa and Arabian Peninsula. (A) Outgoing migrants and (B) incoming migrants by endemicity class. Endemicity classes are colored as: gray, unstable risk; light pink, PfPR2–10 = 0–5%; midpink, PfPR2–10 = 5–40%; and dark red, PfPR2–10 = >40%. Pie chart size is representative of the relative number of migrants.

