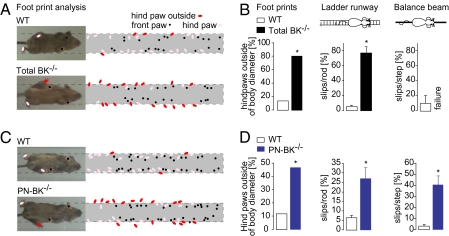
Fig. 1.
Impairments of motor coordination in both total BK−/− and PN-BK−/− mice. (A) Footprint patterns in WT and total BK−/− mice. Left: Mice walking on a glass plate. Their body diameters are indicated by dotted lines. Right: Summary of the superimposed paw positions of four WT and four total BK−/− mice. (B) Bar chart comparison of walking behavior in WT and total BK−/− mice. Left: Summary of A showing the percentage of hindpaw positions outside of the body diameter. Center: Percentage of hindpaw slips relative to the total number of steps on a ladder (n = 7 WT and 4 total BK−/− mice). Right: Percentage of hindpaw slips during running on a balance beam (n = 6 WT and 5 total BK−/− mice). (C) Footprint patterns in WT and PN-BK−/− mice. Right: Summary of the paw positions of 7 WT and PN-BK−/− mice. (D) Histograms indicate the percentage of hindpaw positions outside of the body diameter (Left: summary of the number of red dots in C), the percentage of hindpaw slips relative to the total number of steps on a ladder runway (Center) (n = 12 WT and 11 PN-BK−/− mice), and the percentage of hindpaw slips during running on a balance beam (Right) (n = 9 WT and 9 PN-BK−/− mice). Failure means in this case that the animals are not able to move forward on the beam but fall down. *P < 0.05. Error bars show SEM.

