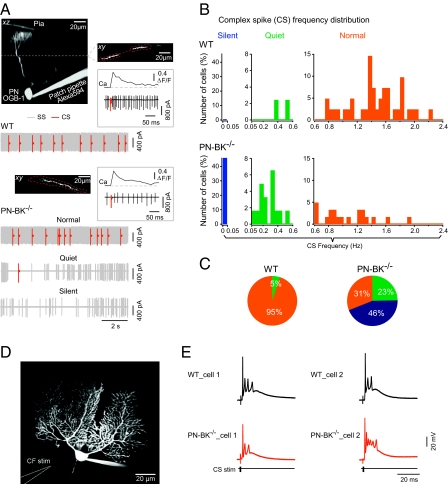
Fig. 2.
Silencing of CS activity in PN-BK−/− mice. (A) Cell-attached recording and Ca2+ imaging of CS activity. Projection images: an electroporated PN filled with Oregon Green BAPTA-1 (OGB-1) from a WT (upper two images) or PN-BK−/− (lower image) mouse. The xy image (Upper Right) is an optical section through the dendritic tree of the PN at the level marked by the dotted line in the xz image (Upper Left). Regions of interest are delineated by dotted red lines. Insets: Examples of individual CSs and the corresponding Ca2+ transients from a WT (Upper) or PN-BK−/− (Lower) cell. Electrical traces: one example of PN activity in a WT cell and three examples in PN-BK−/− cells. The latter represents the three classes of CS activity: silent (0–0.05 Hz), quiet (0.05–0.6 Hz), and normal (0.6–2.4 Hz). The SS and CS are labeled in gray and red, respectively. The continuous gray background reflects high frequency of SS activity. (B) Frequency distribution in the three classes of cells. (C) Pie charts summarize the relative proportion of PNs with silent, quiet, or normal climbing fiber activity (n = 34 WT cells and 57 PN-BK−/− cells; 10 mice for each genotype). (D) Image of a whole-cell patch-clamped PN and the location of the climbing fiber stimulation pipette (CF stim) in a cerebellar slice preparation. (E) Representative traces from two cells of each genotype, showing the characteristic CS waveforms elicited by stimulating the climbing fibers. Note the similarity of the responses (n = 5 WT and 10 PN-BK−/− cells).

