Fig. 3.
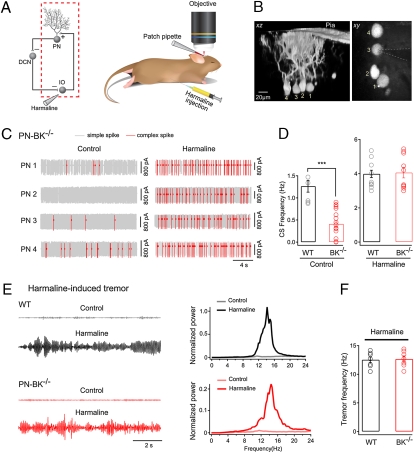
Rescue of CS activity in PN-BK−/− mice by harma-line. (A) Schematic presentation of the olivo-cerebellar circuit (Left) and the segment under examination (red dotted square) when harmaline was i.p. injected (Right). (B) xz and xy projection images of four electroporated PNs in a PN-BK−/− mouse. The pipette for cell-attached recording is indicated by dotted lines. (C) Representative traces recorded before and after harmaline injections from the four PN-BK−/− cells depicted in B. Note that the massive increase in CS activity was observed in all PNs in response to harmaline (20 mg/kg). (D) Summary of the mean CS frequency from both genotypes in the absence (Left) or presence (Right) of harmaline (Control: n = 7 cells in WT and 18 cells in PN-BK−/−; Harmaline: n = 13 cells in WT and 10 cells in PN-BK−/−; four WT and four PN-BK−/− mice). In the presence of harmaline, the CS frequency in PN-BK−/− mice was similar to that found in WT mice. (E) Harmaline-induced tremor in awake, freely moving WT (black) and PN-BK−/− (red) mice. Left: Representative tremor-induced force changes recorded by a pressure sensor before and after harmaline injection. Right: Normalized power spectra of the force measurements. The major, single peak around 10–15 Hz represents the frequency of harmaline-induced tremor. (F) Comparison of the tremor frequency shows no significant difference between WT (12.5 ± 0.5 Hz; n = 7) and PN-BK−/− (12.7 ± 0.5 Hz; n = 7) mice. ***P < 0.001. Error bars show SEM.

