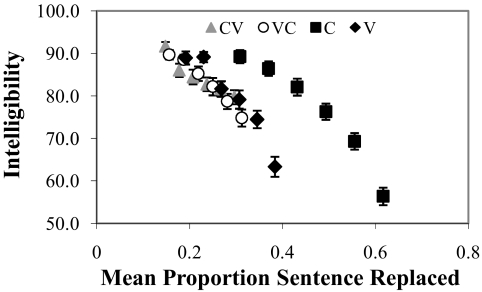
Fig. 3.
Results of experiment 1 (n = 48), with intelligibility plotted as a function of mean proportion sentence replaced. Rightmost symbols denote 100% replacement of Cs and Vs and 50% replacement of CVs and VCs. Data for sentences in CV (gray triangles), VC (white circles), and vowel (black diamond) conditions highly overlap; whereas data for sentences in the consonant condition (black squares) are displaced to the right (greater proportions of sentence replaced). Error bars depict SEM.

