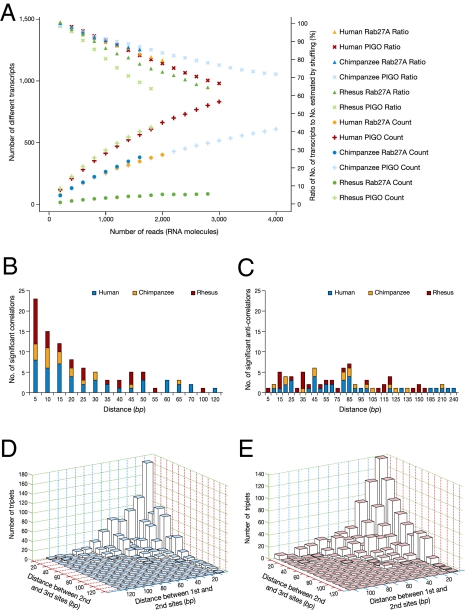
Fig. 4.
Combinatorial behavior and editing site dependencies. (A) Number of different variants as a function of the number of 454 sequencing reads. None of the graphs shows signs of saturation, indicating that the repertoire of different variants is not exhausted. The ratio of the number of different transcripts to the one expected in the absence of site–site correlations (excluding correlations resulting from the overall transcript editing level) is also shown. A ratio significantly less than 1 indicates the existence of significant dependencies between sites (see Dataset S5). (B) Number of significantly correlated and (C) anticorrelated editing-site pairs, as a function of the nucleotide distance between the sites. (D) Number of significantly triplet-correlated and (E) anticorrelated sites as a function of the nucleotide distance spanned by the triplet.

