
Fig. 2.
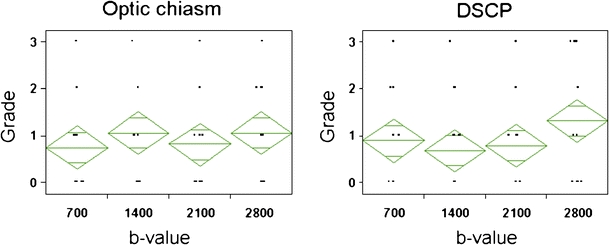
Grade of the fiber tract depiction at optic chiasm and decussation of superior cerebellar peduncle (DSCP) for each b value. Depiction of crossing fiber does not differ significantly by b values, neither at the optic chiasm nor at the DSCP. The breadth of each green rhomboid shows the number of cases in the group, the height shows the 95% confidence interval, the middle line shows the average of the group, and the horizontal lines in the upper and lower parts show the overlap marks. The overlap marks of each of the four groups are not separated in these figures, indicating that there is no significant difference between each group