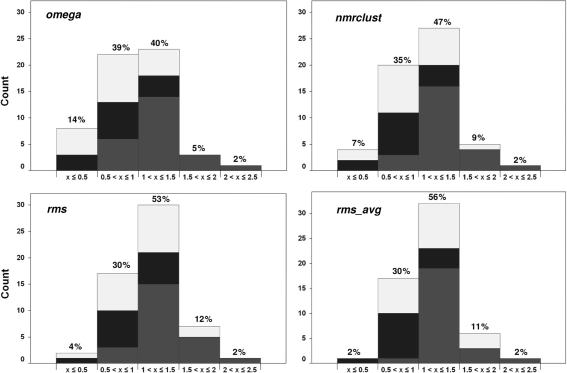
Fig. 3.
Distributions of the minimum RMSDs (x) between each ligand and its bioactive conformer for the four methods employed. The qualitative descriptions are as follows: x < 0.5 = excellent; 0.5 ≤ x < 1.0 = good; 1.0 ≤ x < 1.5 = acceptable; 1.5 ≤ x < 2.0 = still acceptable; x ≥ 2.0 = unacceptable. The numbers above each column represent populations within each RMSD range. The bars are color-coded to indicate the occurrence of rotor categories. Black: Low; Spotted: medium; Gray: High number of rotors

