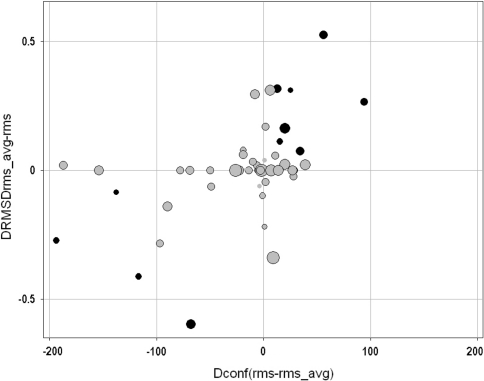
Fig. 4.
Differences in the number of conformers between the rms_avg and rms filtering with respect to RMSD differences between the same sets. The horizontal and vertical axes represent differences in the number of conformers and RMSDs, respectively. Sized by increased flexibility. Black circles indicate ligands whose RMSDs were in different ranges of the qualitative categories. The relatively small number of these bold entries may explain why rms_avg and rms filtering performed very similar in the classification made in Fig. 3

