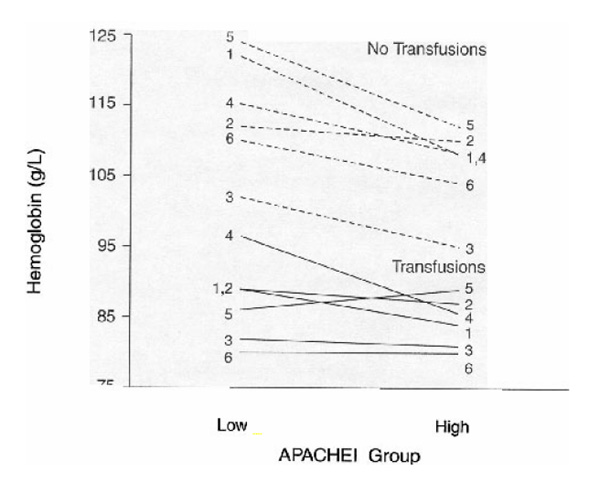
Figure 2.

Average pre-transfusion haemoglobin concentrations stratified by institution, APACHE II categories and transfusion status. Average pre-transfusion hemoglobin concentrations stratified by transfusion status, institution and high (> 15) versus low (≤ 15) APACHE II score. Institution 3 and 6 had the lowest concentrations overall and patients who received red cells. The influence of APACHE II scores appeared least important in centres (3 and 6) with a conservative approach to the administration of red cells. This graph also illustrates significant variations in haemoglobin concentrations in both APACHE II groups and in transfused and non-transfused patients.
