
Fig. 3.
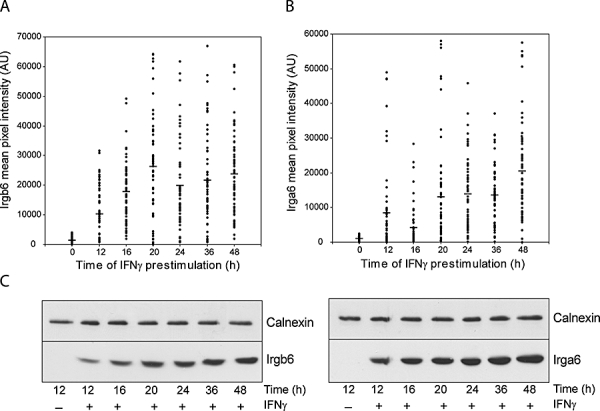
Influence of duration of IFNγ induction on Irga6 and Irgb6 protein levels and on vacuolar loading. MEFs were induced for different times with IFNγ before infection with T. gondii strain ME49 for 2 h and stained in immunofluorescence against Irga6 and Irgb6. Co-staining against GRA7 was used to determine intracellular parasites. A. and B. The pixel intensities of (A) Irgb6 (serum A20) and (B) Irga6 (serum 165) signals at the PVM of ME49 vacuoles were determined as described in Experimental procedures (see also Fig. S1) and displayed as a function of IFNγ induction time. Sixty PVs were quantified per time point and the arithmetic means are given as horizontal lines. C. In parallel sample cell lysates from MEFs induced for the indicated times with IFNγ were analysed by Western blot for Irga6 (mAb 10D7) and Irgb6 (mAb B34) expression level relative to calnexin as a loading control.