Figure 4.

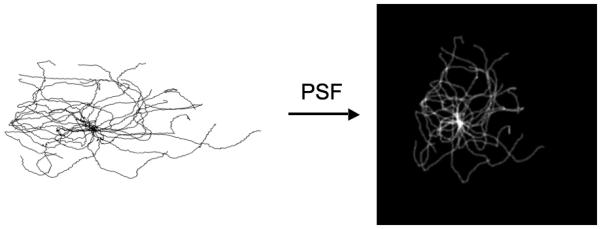
An example rendering of a microtubule 3D model (view from a 3D corner) converted to image (sum projected along Z-axis) using a point spread function. The background color is changed to reflect model and image.

An example rendering of a microtubule 3D model (view from a 3D corner) converted to image (sum projected along Z-axis) using a point spread function. The background color is changed to reflect model and image.