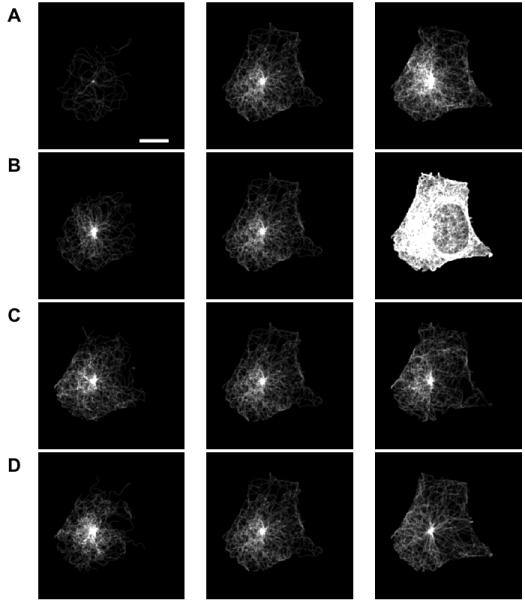
Figure 6.

Effect of variation of model parameters on image appearance. The image whose parameters provide the best match to the image in Figure 1 is shown in the center column, and images with lower or higher values of each parameter are shown in the left and right columns, respectively. (A) Number of Microtubules (B) The Mean and Standard Deviation (C) of the length distribution of microtubules and (D) Collinearity. The scale bar is 10 μm.
