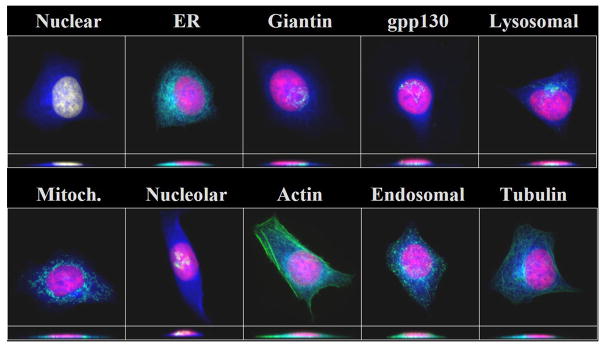
Figure 3.
Typical images from 11-class 3DHeLa image dataset. The eleventh (cytoplasmic) pattern is represented by the blue color. Red, blue and green colors represent DNA staining, total protein staining and target protein fluorescence. Projections on the X-Y (top) and the X-Z (bottom) planes are shown. Image © Carnegie Mellon University; used with permission.

