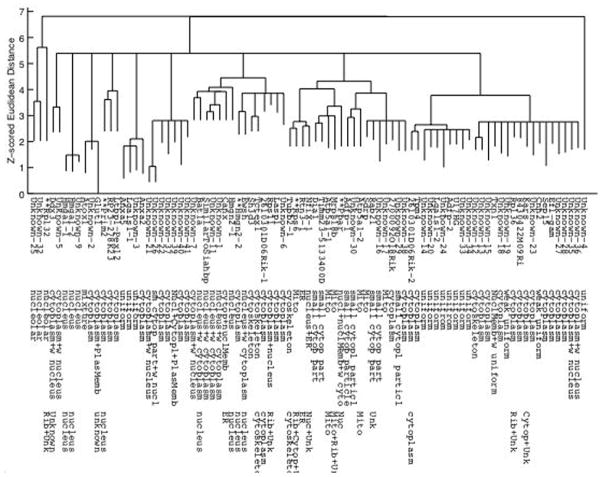
Figure 4.
A consensus subcellular location tree generated on the 3D3T3 image dataset. The rows show the name of the tagged protein (where known), the description assigned from visual inspection, and the subcellular location inferred from annotations in the Gene Ontology (GO) database. Names of proteins whose location from visual inspection differs significantly from that inferred from GO annotation are preceeded with **. The sum of length of vertical edges connecting two proteins represents the distance between them. From reference (26).

