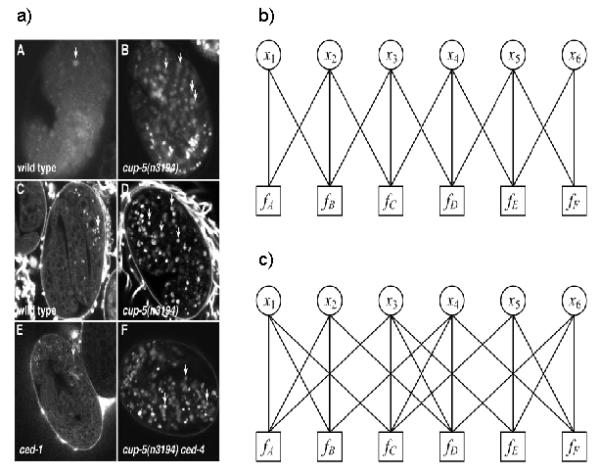
Fig. 1.

Illustration of construction of factor graphs. a) An example figure with six panels (from Hersh et al. 2002). b) A factor graph for the figure in panel (a) in which the neighbors of a panel are determined by its panel serial label. For example, the class probability of panel d is influenced by the class probabilities of panel c and panel e. c) A factor graph in which the neighbors of a panel are determined by their positions. The class probability of panel d is influenced by the class probabilities of panel b, c and f.
