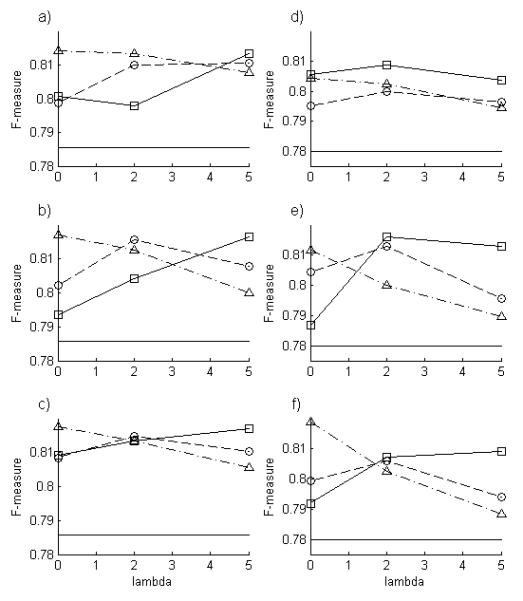
Fig. 5.

Performance of factor graph methods as a function of model parameters. The F-measures for LBP (squares), PULBP1 (circles), and PULBP2 (triangles) are shown for dataset A (left) and B (right) for various values of λ and for α 0.5 (a,d), α = 1 (b,e) and α = 1 (c,f). Note the roles of the model parameters: increasing a corresponds to a shift from inference based solely on panel position to inference based solely on panel serial label, and increasing l corresponds to decreasing influence of neighboring nodes. The F-measure for the baseline classifier is also shown ( ).
).
