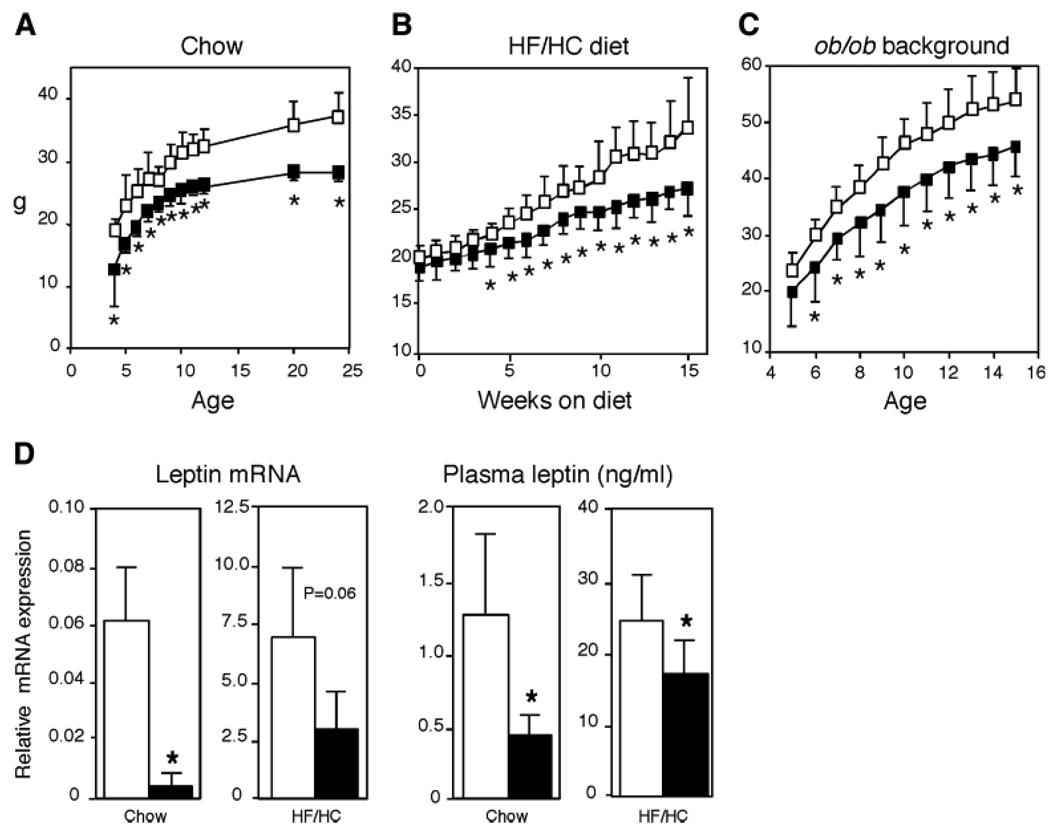
Fig. 3.
Body weight curves and leptin levels in wild-type and Agpat6−/− mice. A: Male mice fed a chow diet from birth to 25 weeks of age. Chow-fed female mice were not analyzed at all time points but exhibited a similar significant difference in body weight compared with wild-type mice at 6 months of age (data not shown). B: Female mice fed a high-fat/high-carbohydrate (HF/HC) diet for 15 weeks beginning at 8 weeks of age. Male mice were not analyzed. C: Female mice on an ob/ob background from 5 to 15 weeks of age. Male mice were not analyzed. For A–C, open and closed squares represent wild-type and Agpat6−/− mice, respectively (n = 8 in each group). D: The left panels represent leptin mRNA levels in gonadal fat tissue determined by real-time PCR (n = 4 for each group). The right panels show plasma leptin levels obtained by ELISA. Open and closed bars represent wild-type and Agpat6−/− mice, respectively. Chow-fed values were from the male mice shown in A and used epididymal fat tissue; HF/HC values were from female mice shown in B and used periuterine fat tissue. * P < 0.05.

