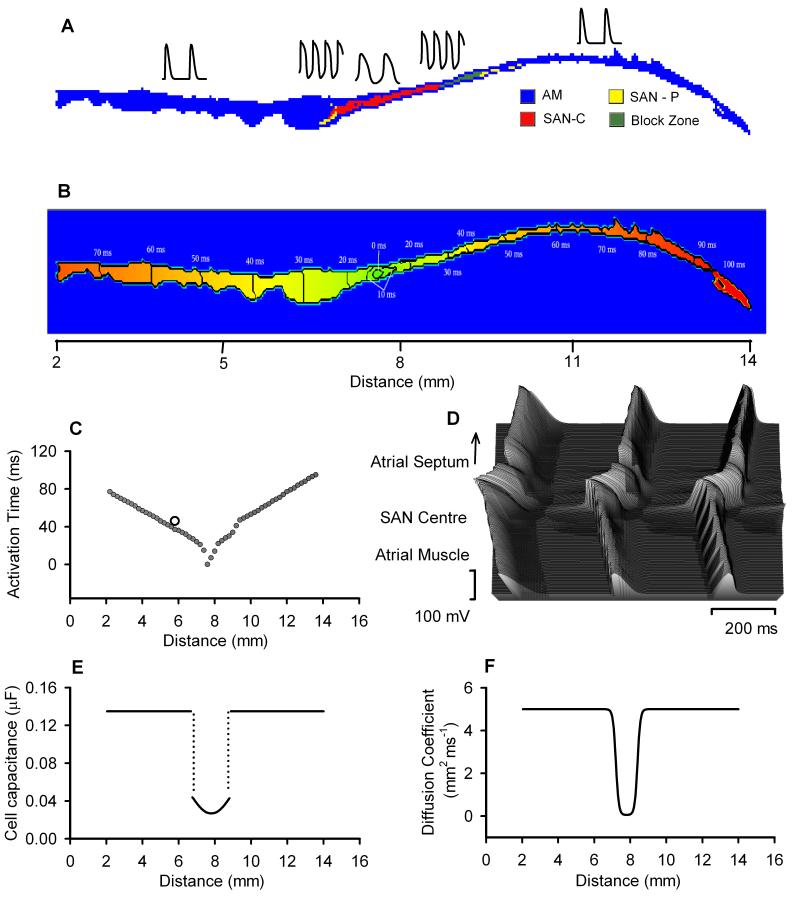
Figure 1.
Model of the rabbit SAN and surrounding atrial tissue. A: colour-coded distribution of cell types throughout the 2D tissue slice. Insets show respective single cell APs. B: spatial distribution of the activation time during normal AP conduction through the 2D slice (rainbow palette). Lines are isochrones and numbers are activation time in ms. C: activation time profile through the middle of the 2D slice; an open circle shows respective experimental data.21 D: AP profiles during conduction through the slice. E: gradient in cell capacitance along the slice. F: gradient in the diffusion coefficient along the slice.

