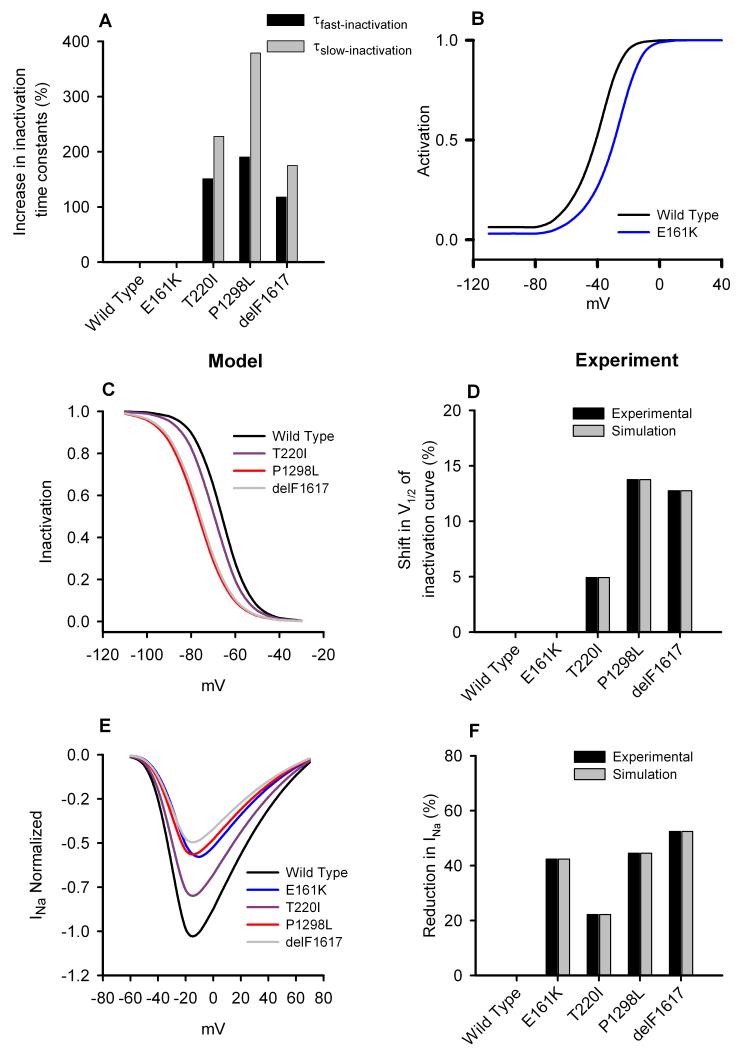
Figure 2.
Effects of the SCN5A mutations on Na+ current in SAN cells. A: percentage increase of the fast and slow Na+ channel inactivation time constants from the WT channel to T220I, P1298L, delF1617 and E161K mutant channels. B: simulated steady-state activation curve for Na+ channel. C: simulated steady-state inactivation curves for Na+ channel. D: relative (to the WT channel) shift of the steady-state inactivation curve from experimental data. E: normalised simulated Na+ channel current density. E: percentage reduction in Na+ current density from the WT channel. For mutation parameter values see Online Table I.

