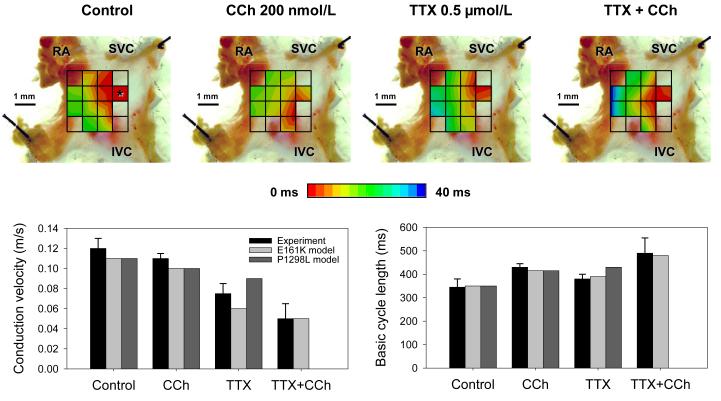
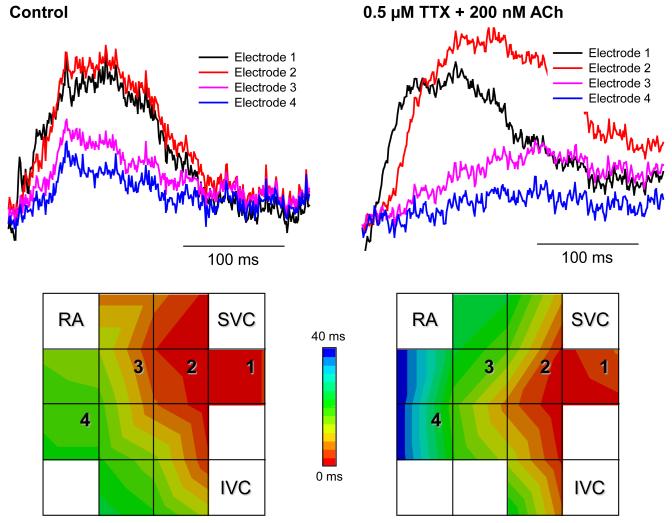
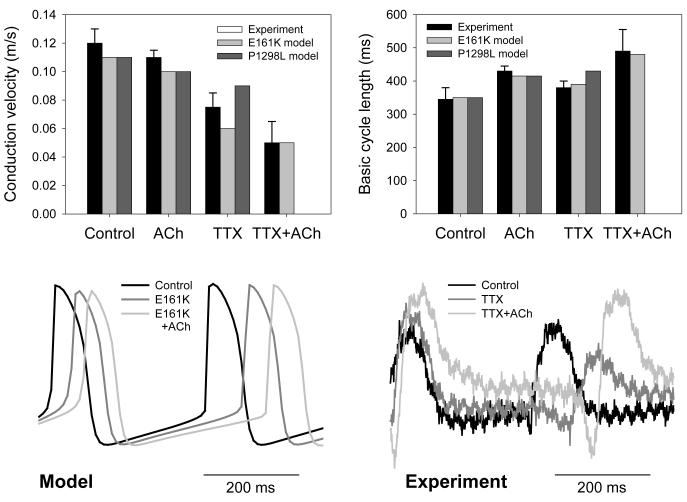
Figure 8.
Experimental validation of the SAN-atrium tissue model. Isolated SAN-atrium tissue with superimposed activation maps (top) show increase of the conduction time from the SAN into the RA due to effects of TTX, CCh and their combination (see panel labels). AP conduction velocities and PCLs under all conditions considered match the respective values simulated with the 2D tissue model (bottom). SVC – superior vena cava, IVC – inferior vena cava. The SAN leading pacemaker cite in control is shown with an asterisk.

