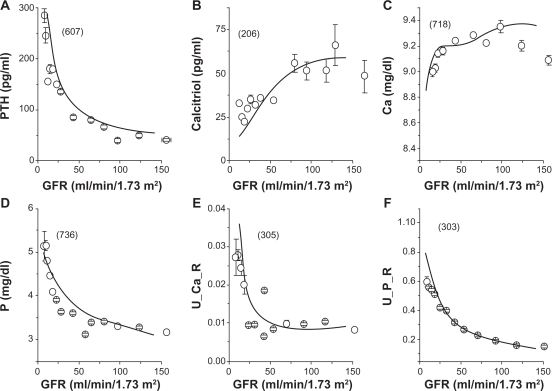
Figure 1.
The glomerular filtration rate (GFR) and the selected physiological states in CKD patients. The numbers in brackets are the numbers of patients. For a description of data gathering and processing see text. A) PTH concentration in serum. B) Calcitriol concentration in serum. C) Ca concentration in serum. D) P concentration in serum. E) Urinary output of Ca expressed as a fraction of the glomerular Ca load (U_Ca_R). F) Urinary output of P expressed as a fraction of the glomerular P load (U_P_R).

