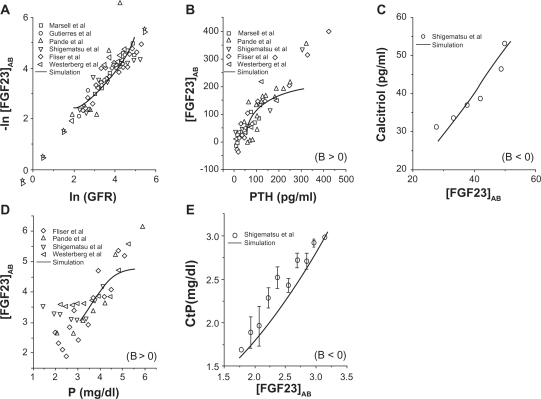
Figure 2.
Evaluation of FGF23 concentrations in serum in CKD patients. To accommodate variations among data sources, the modified FGF23 concentration in a form of [FGF23]AB = {[FGF23]−A}/B is displayed, where A and B are constants. Note that the relationship is a positive correlation with B > 0, while a negative correlation with B < 0. A) Logarithmic relationship between GFR and [FGF23]AB. B) Positive correlation between PTH and [FGF23]AB. C) Negative correlation between [FGF23]AB and calcitriol. D) Positive correlation between P in serum and [FGF23]AB. E) Negative correlation between [FGF23]AB and the renal threshold for P (CtP).

