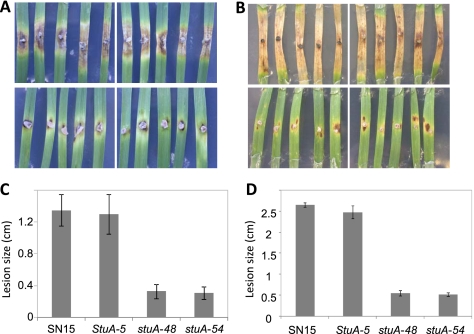
Fig. 5.
Pathogenicity assays at 7 (A and C) and 14 (B and D) dpi. The images of diseased leaves represent infections of the S. nodorum strains SN15 and SnStuA-5 in the top two panels and SnstuA-48 and SnstuA-54 in the bottom panels. The histograms represent the sizes of the lesions corresponding with the images above. Standard error bars are shown (n = 6).

