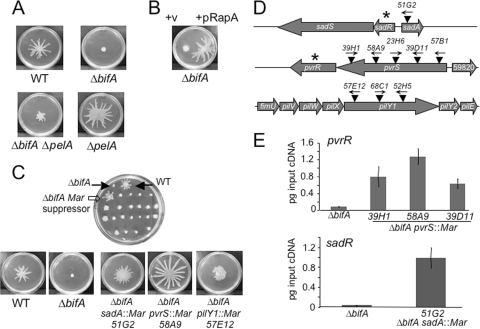
FIG. 1.
Genetic analyses of the ΔbifA swarming defect. (A) Impact of Pel polysaccharide on the ΔbifA swarming impairment. Representative images of swarms formed by the WT, the ΔbifA mutant, the ΔbifA ΔpelA double mutant, and the ΔpelA mutant swarms after 16 h at 37°C on 0.5% swarming agar are shown. (B) Impact of expression of the RapA PDE on swarming motility of the ΔbifA mutant. Representative images of swarms of the ΔbifA mutant carrying the pMQ72 vector control (left) and pMQ72 expressing the RapA c-di-GMP phosphodiesterase (right) are shown. The plates contained 0.2% (wt/vol) arabinose and were incubated for 16 h at 37°C. (C) Genetic screen for suppressors of the ΔbifA swarming impairment. The top image shows a swarm plate from the screen of ΔbifA mariner transposon mutants, with filled arrows indicating the WT control (top right) and the ΔbifA mutant (top left). The open arrow indicates a candidate ΔbifA mariner suppressor mutant. The lower panel shows typical images of swarms of the WT, the ΔbifA mutant, and the ΔbifA sadA::Mar, ΔbifA pvrS::Mar, and ΔbifA pilY1::Mar suppressor mutants. The plates were incubated for 16 h at 37°C. (D) Genetic loci of ΔbifA swarm suppressors. The schematic diagram shows the approximate locations of mariner transposon mutations (▾) in the sadA, pvrS, and pilY1 genes. Arrows above transposons indicate the direction of transcription from the mariner Ptac promoter. Asterisks denote genes encoding predicted c-di-GMP phosphodiesterases. (E) qRT-PCR analysis of pvrR expression in ΔbifA pvrS::Mar suppressor mutants (top panel) and sadR expression in the ΔbifA sadA::Mar suppressor mutant (bottom panel) relative to the ΔbifA single mutant. Expression is plotted as picograms input cDNA for each strain. Error bars indicate standard deviations.

