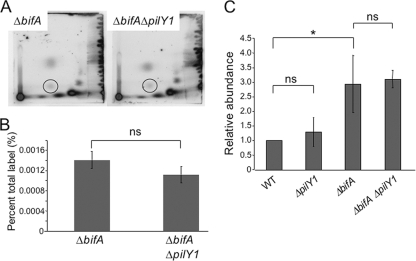
FIG. 3.
Quantification of global c-di-GMP pools. (A) Shown are autoradiographs of representative two-dimensional TLC plates used to separate [32P]orthophosphate-labeled, acid-extracted whole-cell extracts prepared from the ΔbifA mutant and the ΔbifA ΔpilY1 double mutant. The circles indicate the position of c-di-GMP. (B) Quantification of c-di-GMP levels determined by analyzing autoradiographs using the Storm 860 and ImageQuant software (v5.1). The graph shows a representative experiment with results for three replicates of each strain plotted as a percentage of the total 32P label incorporated into c-di-GMP. ns, no statistically significant difference between the ΔbifA mutant and the ΔbifA ΔpilY1 double mutant using the criterion of a P value of <0.05. (C) Quantification of c-di-GMP levels as measured using liquid chromatography-tandem mass spectrometry. The graph depicts the relative abundance of c-di-GMP for three replicates. *, statistically significant difference; ns, no significant difference (using the criterion of a P value of <0.05 by the t test). Error bars indicate standard deviations.

