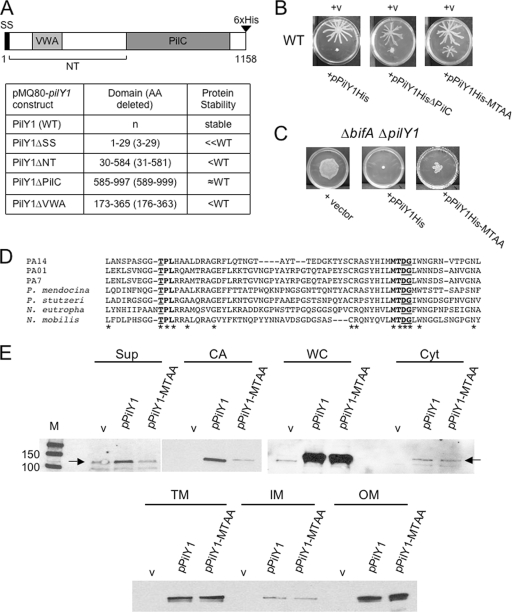
FIG. 7.
Structure/function analysis of PilY1. (A) A schematic diagram of the PilY1 protein. Numbers indicate amino acids, and predicted regions of PilY1 are denoted as follows: signal sequence (SS), N terminus (NT), von Willebrand factor A (VWA), and the domain with similarity to PilC of Neisseria species (PilC). The table lists the pilY1 deletion constructs made in the pMQ80 vector (left column), the amino acids deleted from PilY1 for each construct (middle column), and the protein stability (right column) for each of the expressed proteins relative to the WT protein as assessed by Western blot analysis using the anti-His antibody. WT PilY1 and all PilY1 variants are C-terminally His tagged as indicated in the diagram. (B) Representative images of swarms for the WT carrying either the vector (v), pPilY1His (left), pPilY1HisΔPilC (middle), or the pPilY1His-MTAA mutant construct (right). Plates contained 0.2% arabinose and were incubated for 16 h at 37°C. (C) Partial complementation of the ΔbifA ΔpilY1 mutant by pPilY1His-MTAA. Shown are images of swarms for the ΔbifA ΔpilY1 mutant carrying the vector (left), pPilY1His (middle), or pPilY1His-MTAA (right). Plates contained 0.2% arabinose and were incubated 16 h at 37°C. (D) CLUSTALW-generated amino acid sequence alignment of the PilY1 protein from representative strains listed on the left: P. aeruginosa strains PA14, PAO1, and PA7; Pseudomonas mendocina, Pseudomonas stutzeri, Nitrosomonas eutropha, and Nitrococcus mobilis. Asterisks indicate identical amino acids conserved across the PilY1 proteins shown in the alignment. Bold indicates conserved regions (“TPL” and “MTDG”), with underlined amino acids mutated to alanine residues. (E) Western blot analysis showing cellular localization of PilY1 in the WT carrying either the vector, pPilY1, or pPilY1-MTAA. Cellular fractions are as follows: supernatant (Sup), cell-associated (CA), whole-cell (WC), soluble cytoplasmic (Cyt), total membrane (TM), inner membrane (IM), and outer membrane (OM) fractions. Fractions were separated by SDS-PAGE, and Western blots were probed with the anti-PilY1 polyclonal antibody. The protein size marker (M) is indicated on the top left panel with sizes in kDa. Note that the PilY1 protein expressed from its native promoter can be detected in the TM and IM fractions (Fig. 6) but is not observed in those fractions in this figure due to the shorter exposure times used to detect the PilY1His protein expressed from the arabinose-inducible plasmid. Furthermore, endogenously expressed PilY1 was not detected in the OM fraction (Fig. 6) but can be detected when PilY1 is overexpressed from this plasmid.

