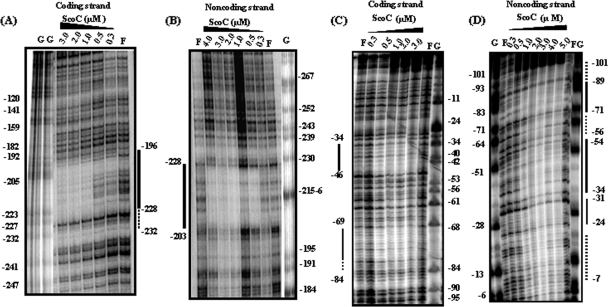
FIG. 3.
DNase I footprint analysis of ScoC binding to the phoPR promoter. The plasmid pBK1 was used as a template for a PCR probe. The ScoC concentration (μM) is shown at the top of each lane. F, free of ScoC; G, Maxam-Gilbert G sequencing reaction, used as a marker. Base pairs are numbered on coding and noncoding strands relative to the translation start site (as +1). Solid lines identify the DNase I protection. Dotted lines identify the weaker protection by ScoC. (A) DNase I protection by on the coding strand in the 5′ region of the phoPR promoter. End-labeled FMH880 and nonlabeled FMH881 were used to create the PCR probe. (B) DNase I protection on the noncoding strand in the 5′ region of the phoPR promoter. End-labeled FMH881 and nonlabeled FMH880 were used to create the PCR probe. (C) DNase I protection on the coding strand of the 3′ promoter region. End-labeled FMH1018 and nonlabeled FMH1019 were used to create the PCR probe. (D) DNase I protection on the noncoding strand of the 3′ promoter region. End-labeled FMH1019 and nonlabeled FMH1018 were used to create the PCR probe.

